2018 was another strong year for sales on St. George Island, Apalachicola, Carrabelle and Eastpoint. Below are the statistics by area:
ST. GEORGE ISLAND:
In 2018 there were 108 sales of single family/condos/town homes compared to 98 sales in 2017 reflecting a 10% increase in total home sales. The average list price for 2018 was $692,712 compared to $678,952 for 2017 reflecting a 2% increase. The average sold price for 2018 was $643,934 compared to $634,148 for 2017 reflecting a 2% increase. The average days on market for 2018 was 200 compared to 148 days on market for 2017 reflecting a 35% increase in days on market. The percentage of sales to list price for both 2018 and 2017 was 93%.
In 2018 there were 63 sales of residential home sites compared to 71 sales in 2017 reflecting a 11% decrease in total lot sales. The average list price for 2018 was $222,630 compared to $174,576 for 2017 reflecting a 28% increase. There average sold price for 2018 was $207,656 compared to $163,503 for 2017 reflecting a 27% increase. The average days on market for 2018 was 259 compared to 209 days on market for 2017 reflecting a 24% increase in days on market. The percentage of sales to list price for 2018 was 93% compared to 94% 2017 reflecting a 1% decrease.
APALACHICOLA:
In 2018 there were 53 sales of single family/condos/town homes/mobile homes compared to 57 sales in 2017 reflecting a 7% decrease in total home sales. The average list price for 2018 was $290,498 compared to $233,561 for 2017 reflecting a 24% increase. The average sold price for 2018 was $270,262 compared to $218,187 for 2017 reflecting a 24% increase. The average days on market for 2018 was 193 compared to 198 days on market for 2017 reflecting a 3% decrease in days on market. The percentage of sales to list price for both 2018 and 2017 was 93%.
In 2018 there were 30 sales of residential home sites compared to 31 sales in 2017 reflecting a 3% decrease in total lot sales. The average list price for 2018 was $79,553 compared to $60,712 for 2017 reflecting a 31% increase. There average sold price for 2018 was $70,752 compared to $52,777 for 2017 reflecting a 34% increase. The average days on market for 2018 was 467 compared to 305 days on market for 2017 reflecting a 53% increase in days on market. The percentage of sales to list price for 2018 was 89% compared to 87% 2017 reflecting a 2% increase.
CARRABELLE:
In 2018 there were 79 sales of single family/condos/town homes compared to 95 sales in 2017 reflecting a 17% decrease in total home sales. The average list price for 2018 was $249,328 compared to $184,925 for 2017 reflecting a 35% increase. The average sold price for 2018 was $231,777 compared to $170,890 for 2017 reflecting a 36% increase. The average days on market for 2018 was 188 compared to 120 days on market for 2017 reflecting a 57% increase in days on market. The percentage of sales to list price for 2018 was 93% compared to 92% for 2017 reflecting a 1% increase.
In 2018 there were 75 sales of residential home sites compared to 81 sales in 2017 reflecting a 7% decrease in total lot sales. The average list price for 2018 was $67,601 compared to $61,825 for 2017 reflecting a 9% increase. There average sold price for 2018 was $57,783 compared to $49,854 for 2017 reflecting a 16% increase. The average days on market for 2018 was 205 compared to 202 days on market for 2017 reflecting a 1% increase in days on market. The percentage of sales to list price for 2018 was 85% compared to 82% 2017 reflecting a 5% increase.
EASTPOINT:
In 2018 there were 25 sales of single family/condos/town homes compared to 18 sales in 2017 reflecting a 39% increase in total home sales. The average list price for 2018 was $244,200 compared to $246,722 for 2017 reflecting a 1% decrease. The average sold price for 2018 was $224,076 compared to $232,144 for 2017 reflecting a 3% decrease. The average days on market for 2018 was 236 compared to 96 days on market for 2017 reflecting a 146% increase in days on market. The percentage of sales to list price for 2018 was 92% compared to 94% in 2017 reflecting a 2% decrease.
In 2018 there were 31 sales of residential home sites compared to 35 sales in 2017 reflecting a 11% decrease in total lot sales. The average list price for 2018 was $37,450 compared to $55,087 for 2017 reflecting a 32% decrease. There average sold price for 2018 was $31,785 compared to $41,007 for 2017 reflecting a 22% decrease. The average days on market for 2018 was 354 compared to 180 days on market for 2017 reflecting a 97% increase in days on market. The percentage of sales to list price for 2018 was 85% compared to 74% 2017 reflecting a 15% increase.
Sales activity for the month of December 2018 was somewhat slow with 25 total sales – 14 single family homes, 1 condo/town home, 1 mobile home and 9 residential home sites. Carrabelle saw the most activity with 10 total sales – 4 single family homes, 1 mobile home and 5 residential home sites. There were 4 total sales on St. George Island – 3 single family homes and 1 residential home site. Apalachicola had 9 total sales – 5 single family homes, 1 commercial condo and 3 residential home sites. There were sales of 2 single family homes in Eastpoint. Sales prices ranged from a low of $8,000 for a residential home site in Carrabelle Landing to $950,000 for a 4 bedroom/4.5 bath bay front home in Apalachicola.
See activity of sales activity by area below:
ST. GEORGE ISLAND
RESIDENTIAL HOME SITES:
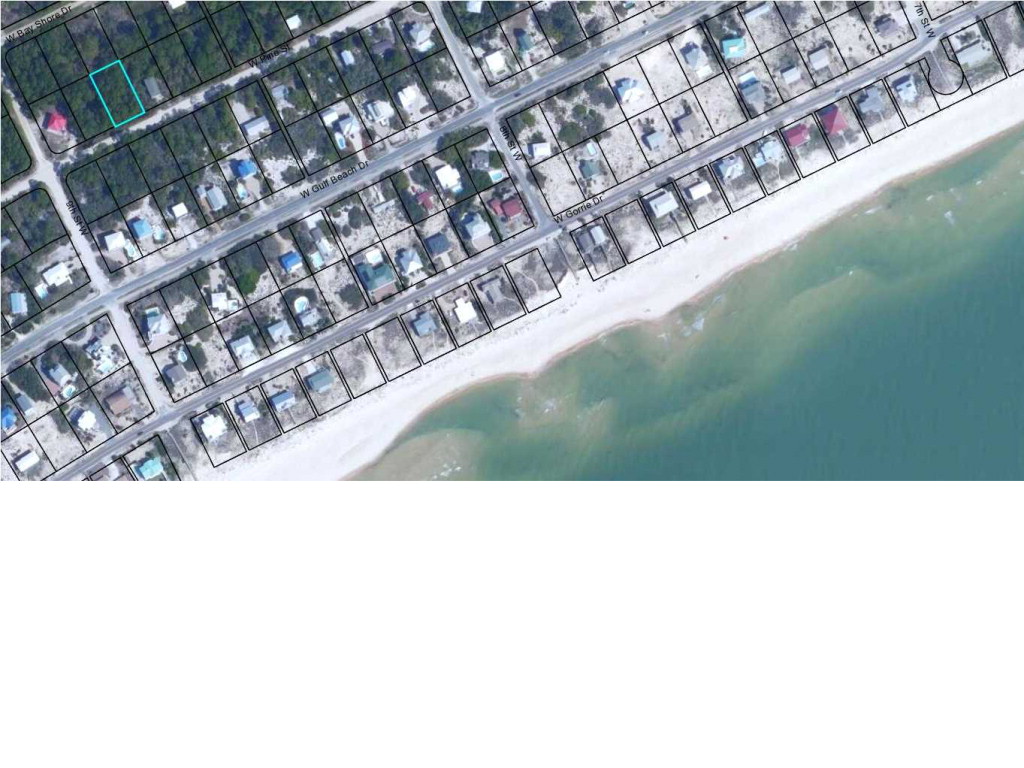
MLS# 261568 – 873 W. Pine Ave. – .33 acre lot located in the Gulf Beaches. List price – $63,000 Sold price – $58,500 Days on market – 258 Days under contract – 14 Cash purchase
SINGLE FAMILY HOMES:
MLS# 262692 – 316 Howell St. – 4 bedroom/3 bath ground level home located in the Gulf Beaches List price – $229,000 Sold price – $151,500 Days on market – 179 Days under contract – 84 Conventional financing
MLS# 262082 – 649 W. Pine Ave. – 4 bedroom/2.5 bath gulf view home with private pool located in the Gulf Beaches List price – $549,000 Sold price – $480,000 Days on market – 169 Days under contract – 34 Conventional financing
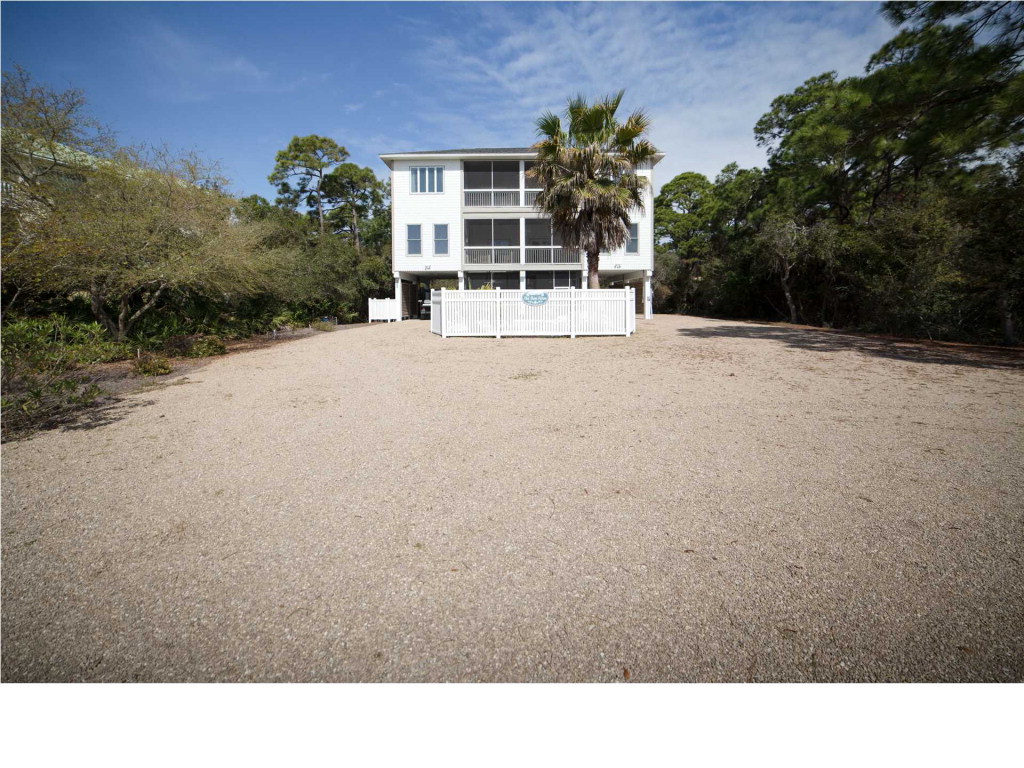
MLS# 300599 – 36 E. Gorrie Dr. – 3 bedroom/3.5 bath gulf front “shot gun” home located in the Gulf Beaches List price – $649,000 Sold price – $489,200 Cash purchase – Owner sold to friend for mortgage balance only and not true appraisal or market value
APALACHICOLA
RESIDENTIAL HOME SITES:
MLS# 300191 – 176 River Chase Dr. – .50 acre river front lot located in Manatee Bluff in Greater Apalachicola List price – $75,000 Sold price – $55,000 Days on market – 4 Days under contract – 22 Cash purchase
MLS# 262946 – 136 Cedar Oaks Ln. – 1.01 acre river front lot located in Greater Apalachicola List price – $145,000 Sold price – $100,000 Days on market – 76 Days under contract – 28 Cash purchase
MLS# 262566 – 488 Bay City Rd. – 7.5 acre parcel located in Greater Apalachicola List price – $185,000 Sold price – $165,000 Days on market – 130 Days under contract – 25 Cash purchase
SINGLE FAMILY HOMES/CONDOS:
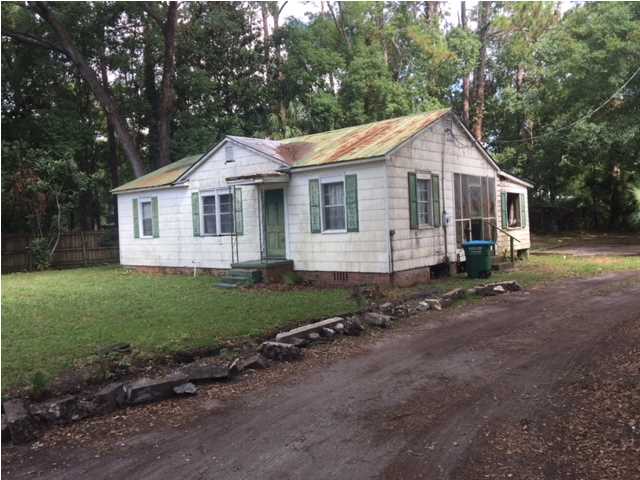
MLS# 262351 – 113 Kevin Rd. – 3 bedroom/2 bath bank owned home located in Greater Apalachicola List price – $39,900 Sold price – $30,000 Days on market – 179 Days under contract – 22 Cash purchase
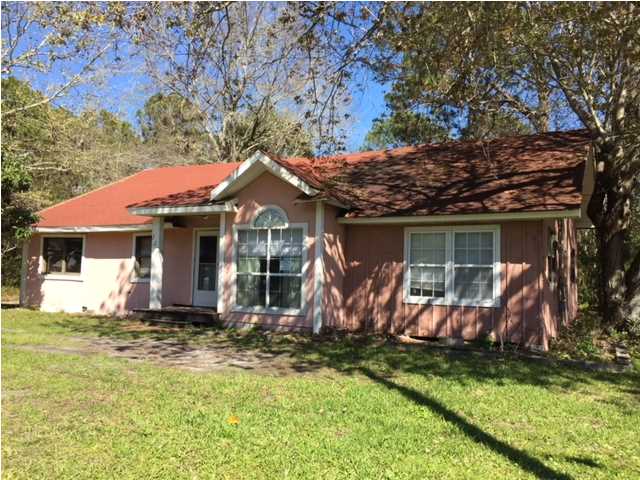
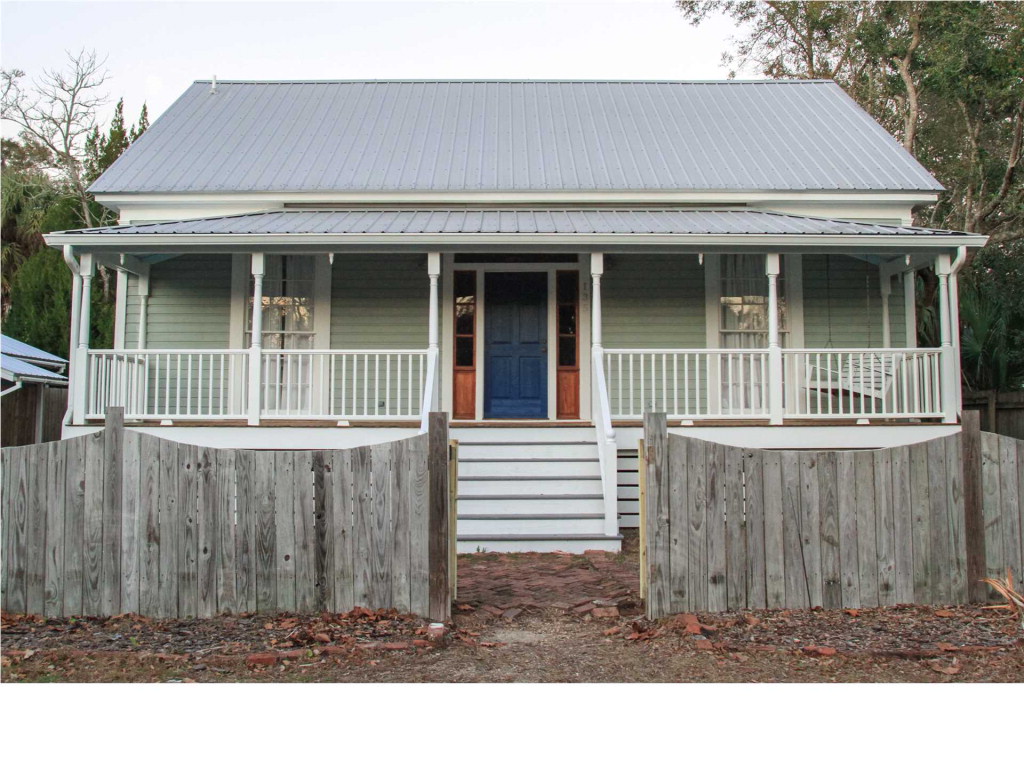
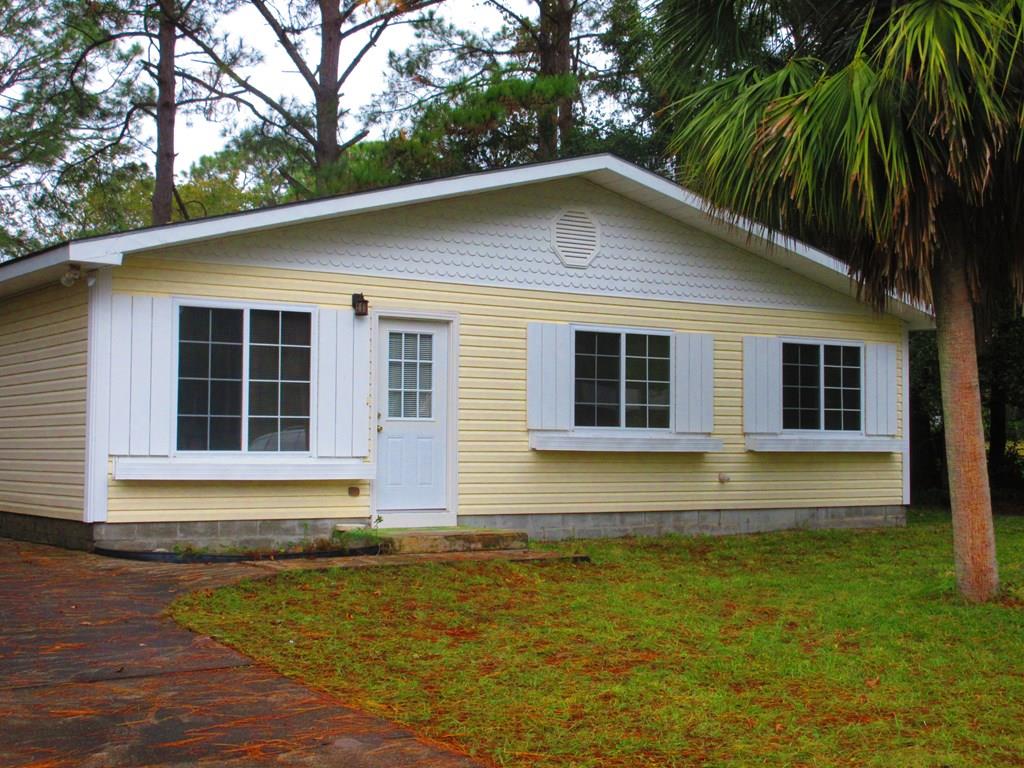
MLS# 262507 – 267 Hwy. 98 – 3 bedroom/1 bath home located in Philaco Shores in Greater Apalachicola List price – $84,900 Sold price – $55,000 Days on market – 155 Days under contract – 17 Cash purchase
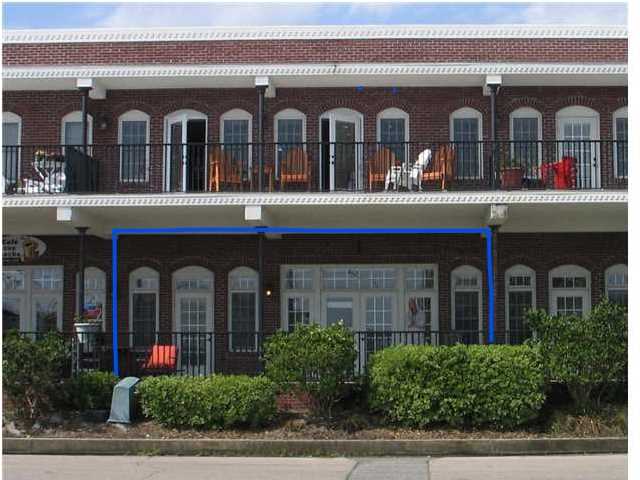
MLS# 258832 – 236 Water St. – Commercial condo in High Cotton Market place in downtown Apalachicola List price – $180,000 Sold price – $170,000 Days on market – 563 Days under contract – 71 Conventional financing
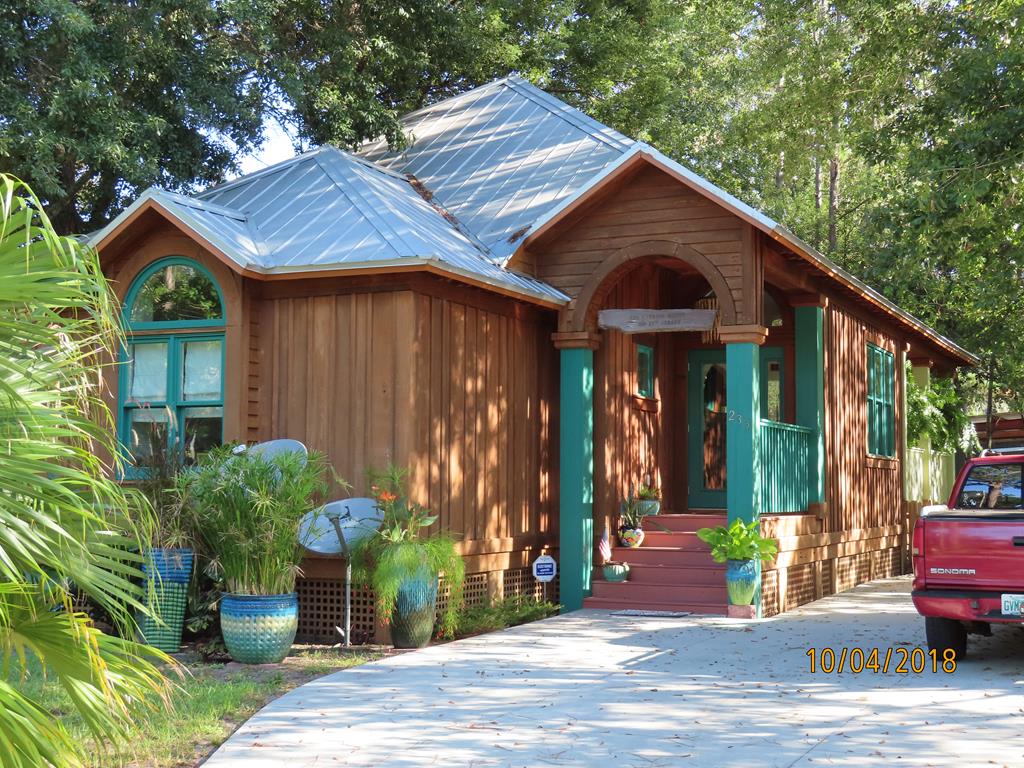
MLS# 263022 – 233 17th St. – 2 bedroom/2 bath cottage located in Greater Apalachicola List price – $289,900 Sold price – $275,000 Days on market – 83 Days under contract – 19 days Cash purchase
MLS# 262221 – 135 5th St. – 2 bedroom/1 bath cottage originally constructed in 1800 located in the North Historic district List price – $310,000 Sold price – $290,000 Days on market – 158 Days under contract – 35 Cash purchase
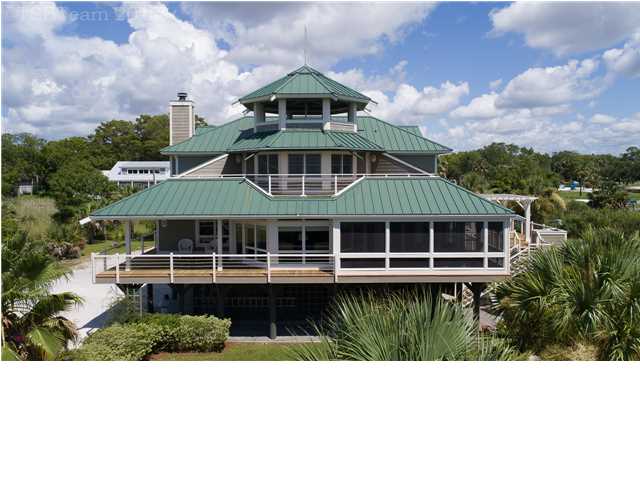
MLS# 259734 – 1 Battery Park – 4 bedroom/4.5 bath bay front home located in the Historic South side List price – $1,295,000 Sold price – $950,000 Days on market – 445 Days under contract – 68 Conventional financing – Price reflects garage removed after Hurricane Michael
CARRABELLE
RESIDENTIAL HOME SITES:
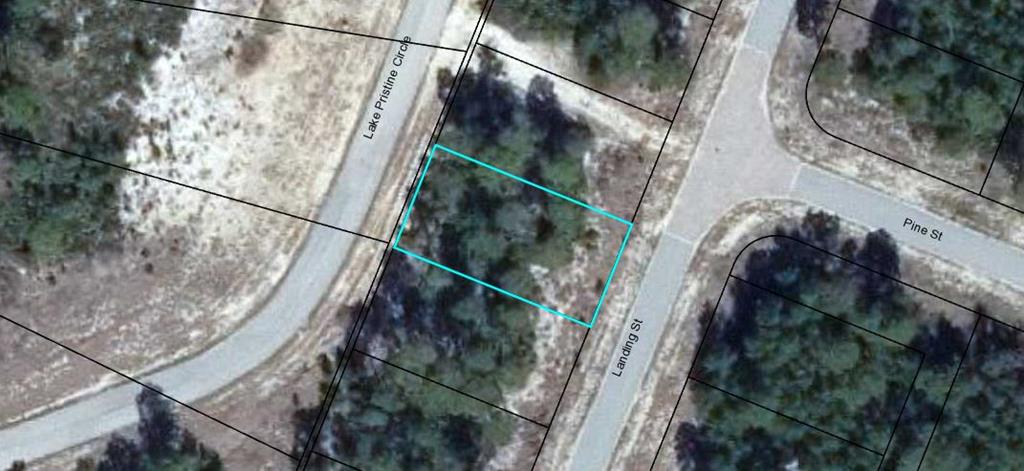
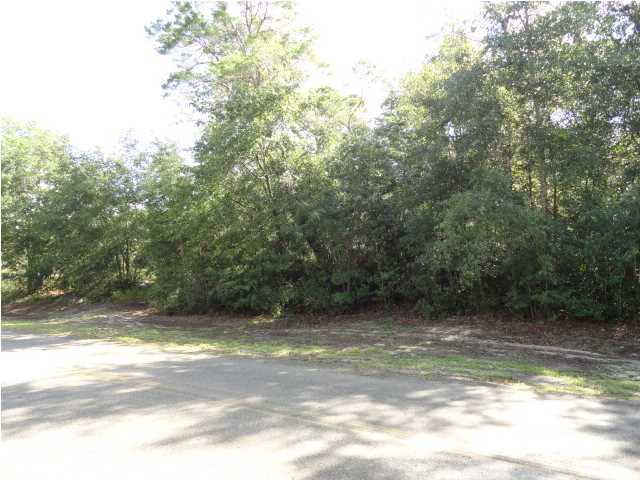
MLS# 300137 – 1706 Landing St. – .16 acre lot located in Carrabelle Landing List price – $8,500 Sold price – $8,000 Days on market – 24 Days under contract – 12 Cash purchase – No contingencies
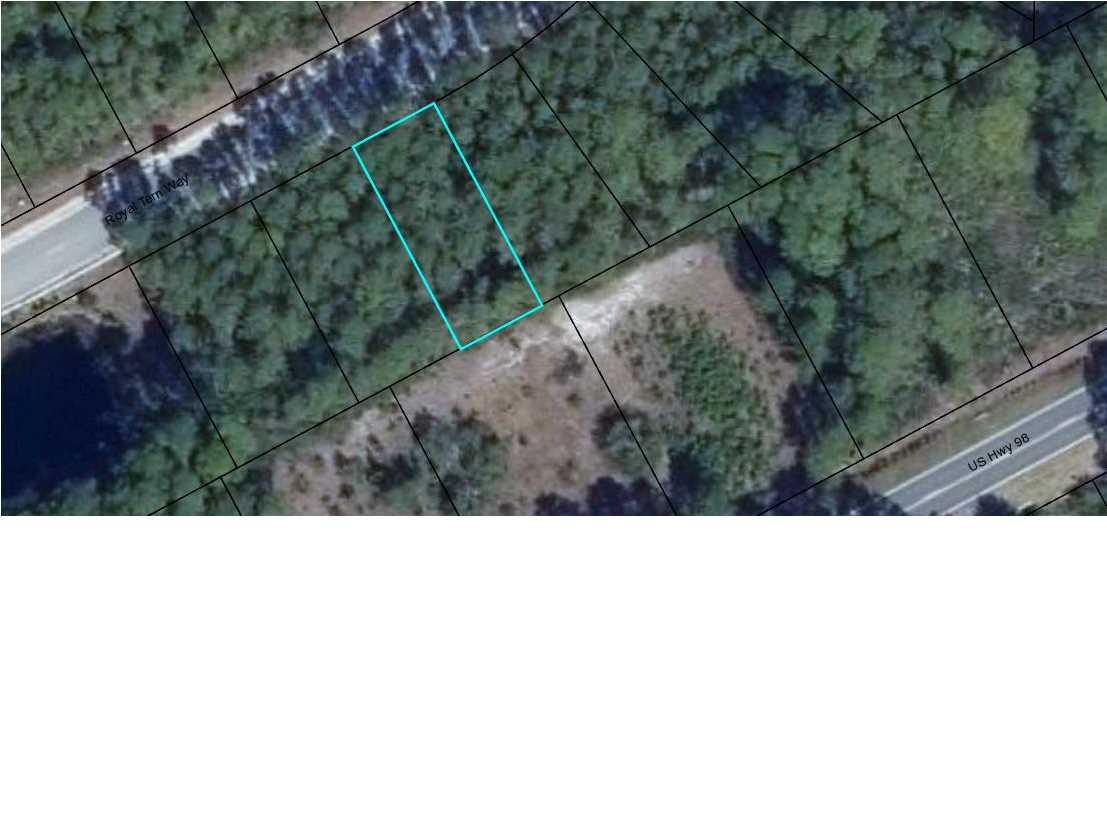
MLS# 263042 – 162 Royal Tern Way – .13 acre lot located in St. James Bay List price – $12,000 Sold price – $10,000 Days on market – 100 Days under contract – 10 Cash purchase
MLS# 263040 – 406 7th St. – .12 acre lot located in Pickett’s Addition in Carrabelle List price – $16,500 Sold price – $14,500 Days on market – 70 Days under contract – 28 Conventional financing

MLS# 263047 – 404 7th St. – .12 acre lot located in Pickett’s Addition in Carrabelle List price – $16,500 Sold price – $14,500 Days on market – 67 Days under contract – 28 Conventional financing
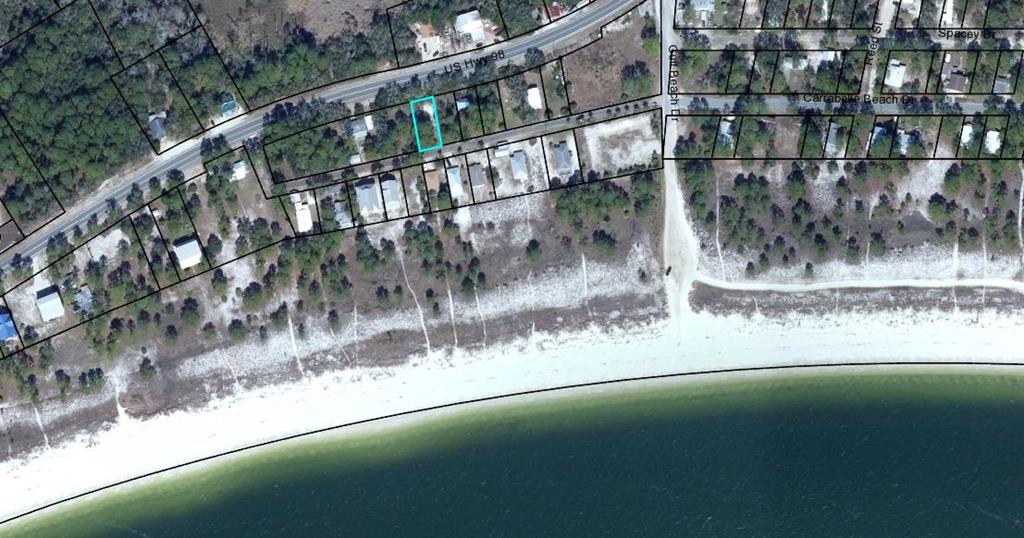
MLS# 300189 – 1769 Carrabelle Beach Dr. – .12 acre 1st tier lot located in Carrabelle Beach List price – $59,000 Sold price – $52,000 Days on market – 14 Days under contract – 15 Seller financing
SINGLE FAMILY HOMES/MOBILE HOMES:
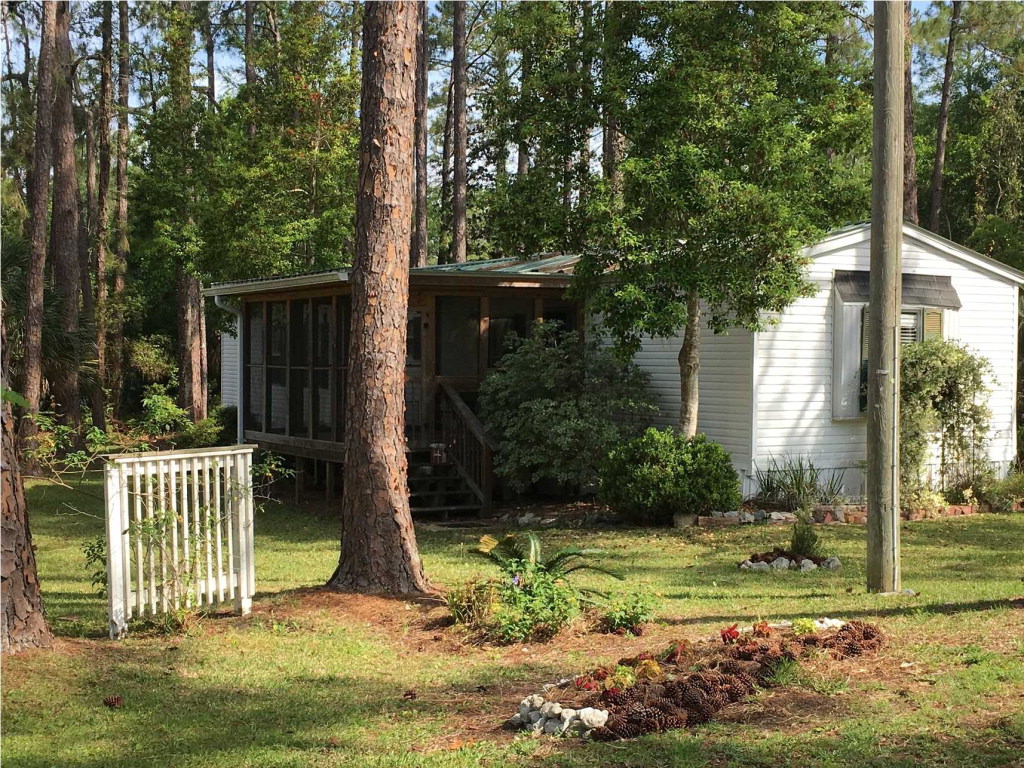
MLS# 261848 – 800 Three Rivers Rd. – 2 bedroom/2 bath mobile home with river view List price – $89,900 Sold price – $85,000 Days on market – 218 Days under contract – 20 Cash purchase
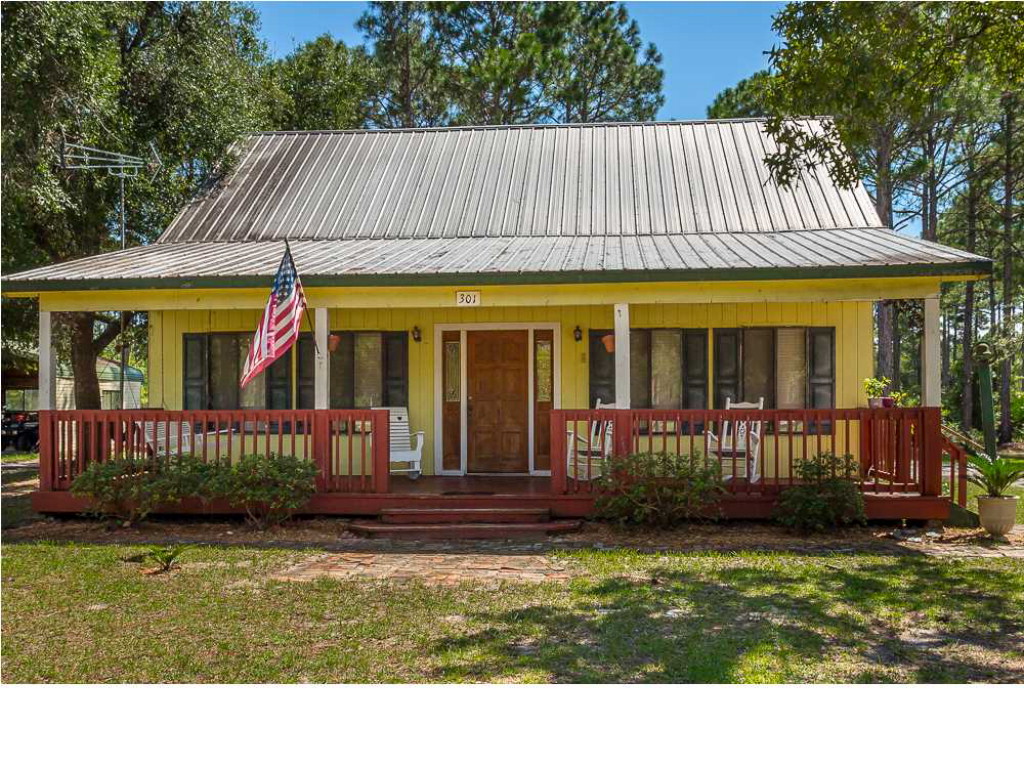
MLS# 300142 – 110 Franklin St. – 3 bedroom/1 bath home located in Lanark List price – $129,000 Sold price – $121,000 Days on market – 10 Days under contract – 40 Conventional financing
MLS# 300310 – 248 River Rd. – 3 bedroom/3 bath river view home in Carrabelle List price – $149,000 Sold price – $149,000 Days on market – 10 Days under contract – 17 Cash purchase
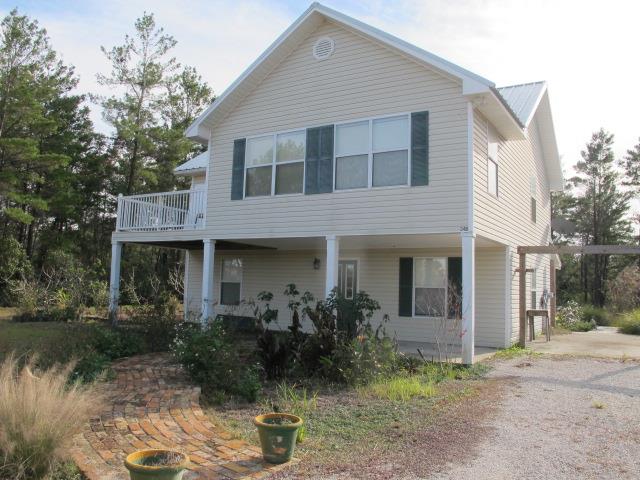
MLS# 263079 – 301 Baywood Dr. – 2 bedroom/2 bath home located in Baywood Estates List price – $183,000 Sold price – $145,000 Days on market – 67 Days under contract – 20 Cash purchase
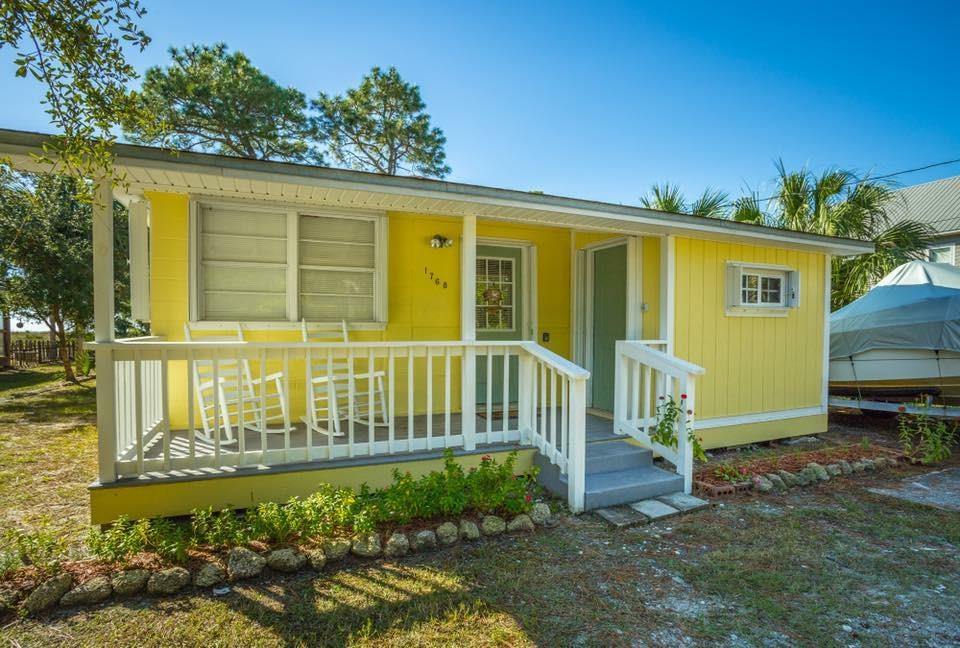
MLS# 300190 – 1768 Carrabelle Beach Dr. – 2 bedroom/2 bath gulf view home located in Carrabelle Beach List price – $197,500 Sold price – $193,000 Days on market – 14 Days under contract – 15 Cash purchase
EASTPOINT
SINGLE FAMILY HOMES:
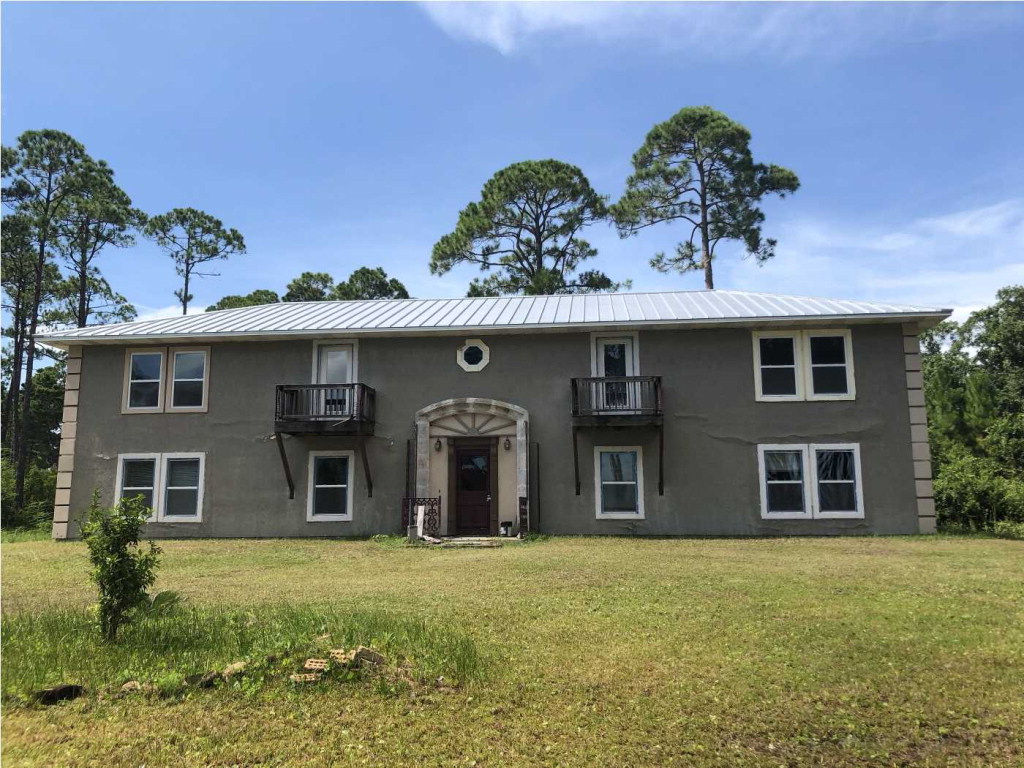
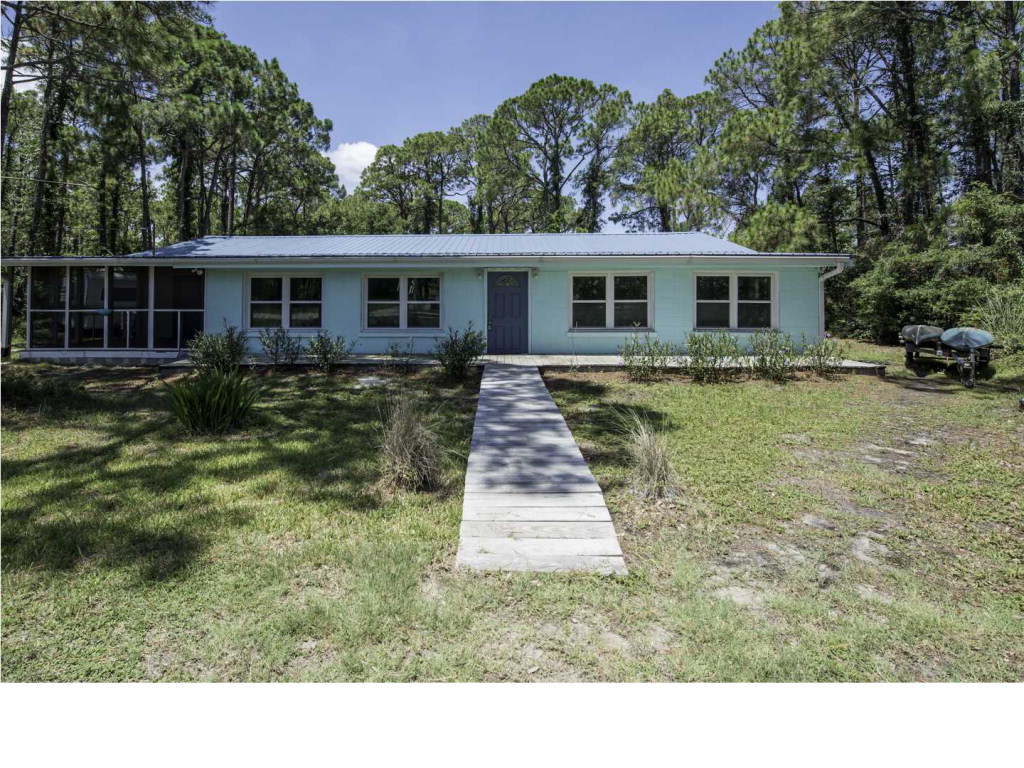
MLS# 261069 – 287 Hwy. 98 – 4 bedroom/4 bath home zoned residential/commercial List price – $169,000 Sold price – $150,000 Days on market – 278 Days under contract – 40 days Cash purchase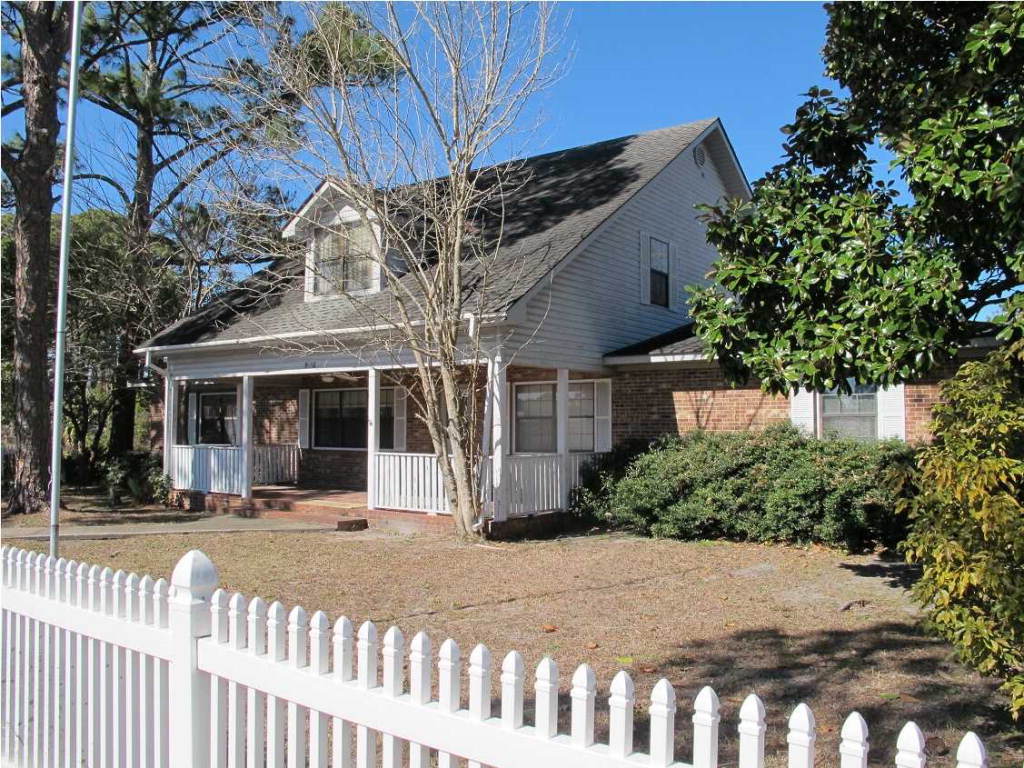
MLS# 262839 – 1301 Hwy. 98 – 8 bedroom/8 bath four-plex (2 bedroom/1 bath units with kitchenettes) List price – $299,000 Sold price – $220,000 Days on market – 6 Days under contract – 132 Cash purchase